Intro
By 2022, it’s anticipated that the global enterprise video market would grow to $40.84 billion. That represents a growth rate of more than 20% annually. According to research, more than 30% of sports enthusiasts now watch games on their smartphones or tablets. Live video is increasingly important. That means you should pay close attention to how it performs via stream analytics.
It’s the right thing to stream live video on your website. Video, and particularly live video, is quickly rising to the top of the list of business communication tools. How can you tell whether you’re effectively using video if you’re using it? You must use stream analytics to continuously monitor your live video feed as part of the solution.
This article will show you why and how to gather data on your live streams and with YoloCast, it’s even better and simpler.
Monitoring Live Streams
You must determine the value of video to your business in order to prevent issues from developing. We’ll look at two significant types of assessments you may use to evaluate the effectiveness of your live streaming in the sections that follow. Then, we’ll continue with a discussion of analytics.

Equipment Checks
The worst nightmare of most streamers is some sort of equipment failure. Additionally, there isn’t a really effective way to check equipment while you are streaming, which is terrible. As a result, it’s crucial to check our equipment before going live.
We advise you to test all your streaming devices. Verify that it operates properly in a real-world live streaming scenario. Additionally, after a significant amount of live broadcasting, you want to confirm that it still functions. Test during an extended use-case scenario because equipment can get hot over time. Having a backup plan in place in case of breakdowns can be a good idea.
If you experience any problems, be ready to pull out any gear and replace it. We recommend using hardware like YoloBox lineups for your live streams.
Real-time Stream Analytics
Let’s move on to the article’s second main focus, real-time stream analytics. Your streaming solution’s live stream analytics enable you to compile data on your live events. Real-time analytics function in real-time, as their name suggests. For modern, data-driven firms, this is crucial.
You can measure different forms of information with the aid of standard analytics. This comprises:
- How many viewers are watching your videos
- Number of unique visitors
- Number of repeat visitors
- How many people view each video or stream
- Total viewers for all content
- Country of origin
- Total bandwidth used
- Bandwidth used by a given video or live streaming channel
- Revenue per video

Measuring Viewer Count, Location, and More
Live stream analytics provided by video streaming platforms like YoloCast allows you to gather data including viewer count and location. This includes the number of viewers at any given point in time, and where your audience is mostly located. You can also get data like average viewing time per person and average viewing time per video from live analytics.
Why You Need Real-Time Analytics
The answer is simple – to modify the video strategy and content based on stream analytics data. You can use the knowledge you learn from data collection to enhance your video strategy. You may measure the success of your live streaming events, for instance, by looking at viewing statistics generally. You can utilize geographic data to determine whether you should stream in another language. You can utilize average data rates to help you choose the best bitrates to stream, etc.
When you invest in analytics tracking, you can use that information to make good business decisions and build that very authenticity.
YoloCast Real-Time Analytics Dashboard
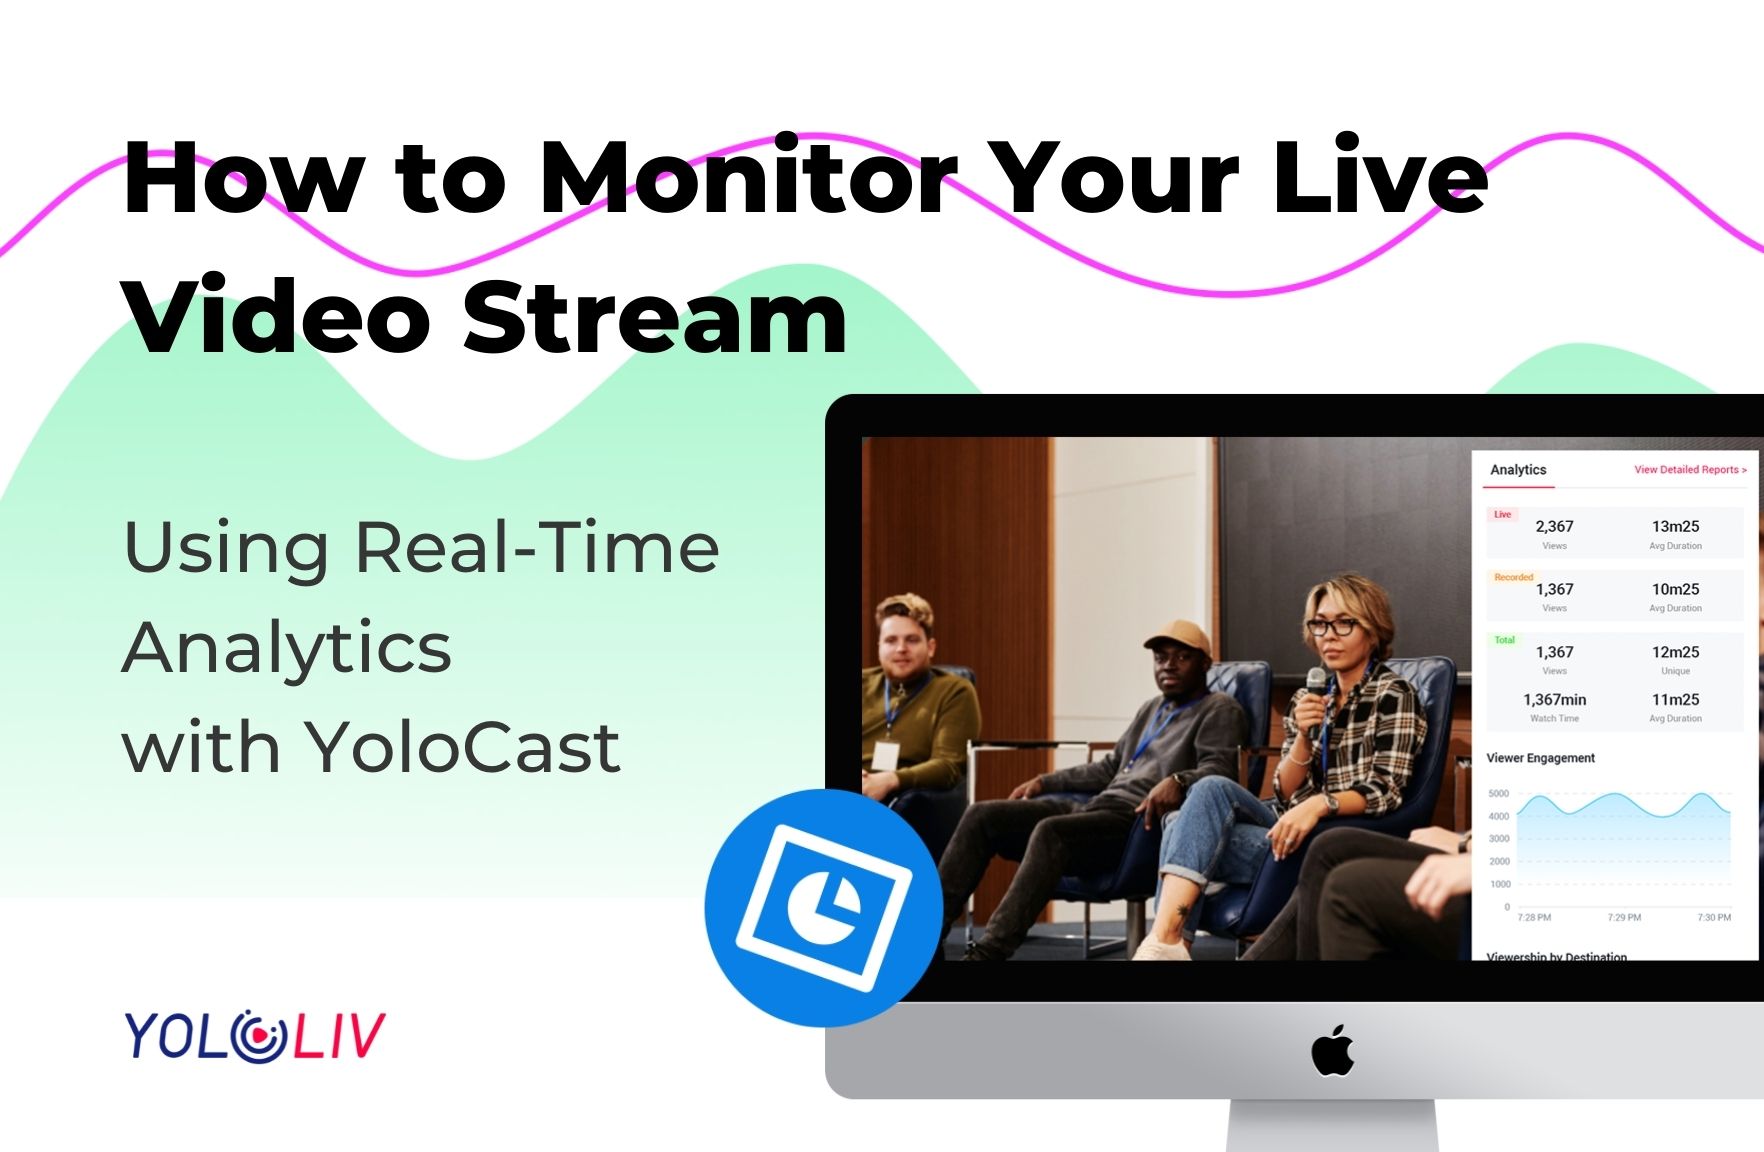
We’re pleased to introduce that YoloCast is now offering real-time stream analytics for exclusive customers. This will allow broadcasters to access:
- Live Views;
- Live Average Duration;
- Recorded Views;
- Recorded Average Duration;
- Total Views;
- Unique;
- Total Watch Time;
- Total Average Duration;
- Viewer Engagement and Viewership by Destination.
Simply go to “Event Details” -> “Analytics”
You can also check more detailed data by clicking the “View Detailed Reports”.
It will direct to the YoloCast’s dashboard – > Reports -> Summary
From here, you can access reports with detailed data. We count the viewing data of T+1 day events so that anchors can analyze monthly (in-cycle) events and understand audience preferences to improve the quality of their broadcasts:
To track all the events hosted in the past:
Conclusion
We hope that this blog has given you a better understanding of the value of real-time monitoring and stream analytics for your live streams. Regarding the YoloCast real-time analytics feature, we hope all of our users will benefit from some potent new insights from it.
Finally, if you haven’t already started streaming with YoloCast, we invite you to take advantage of our free trial (no credit card required). Click the button below to sign up today!
For regular tips and exclusive offers, you are also invited to join our Facebook group. Do you have further questions or feedback about this article? We’d love to hear from you. Contact us
Thanks for reading, and as always – Happy streaming!

Karen, customer success manager at YoloLiv. She proactively looks out for customers’ needs and suggests ways to help customers succeed with our products. All the successful use cases/ stories are the proof.


